Updates tracing docs with the latest stufffff

Closes https://codeberg.org/superseriousbusiness/gotosocial/issues/4446

Reviewed-on: https://codeberg.org/superseriousbusiness/gotosocial/pulls/4452
Co-authored-by: tobi <tobi.smethurst@protonmail.com>
Co-committed-by: tobi <tobi.smethurst@protonmail.com>
2.8 KiB
Tracing
GoToSocial comes with OpenTelemetry based tracing built-in. It's not wired through every function, but our HTTP handlers and database library will create spans that may help you debug issues.
Enabling tracing
To enable tracing on your instance, you must set tracing-enabled to true in your config.yaml file. Then, you must set the environment variable OTEL_TRACES_EXPORTER to your desired tracing format. A list of available options is available here. Once you have changed your config and set the environment variable, restart your instance.
If necessary, you can do further configuration of tracing using the other environment variables listed here.
Ingesting traces
In order to receive the traces, you need something to ingest them and then visualise them. There are many options available including self-hosted and commercial options.
In example/tracing we provide an example of how to do this using Grafana Tempo to ingest the spans and Grafana to explore them. You can use the files with docker-compose up -d to get Tempo and Grafana running.
Please be aware that while the example configuration we provide can be used safely for local development and can provide a good starting point for setting up your own tracing infrastructure, it is not suitable for a so-called "production" setup.
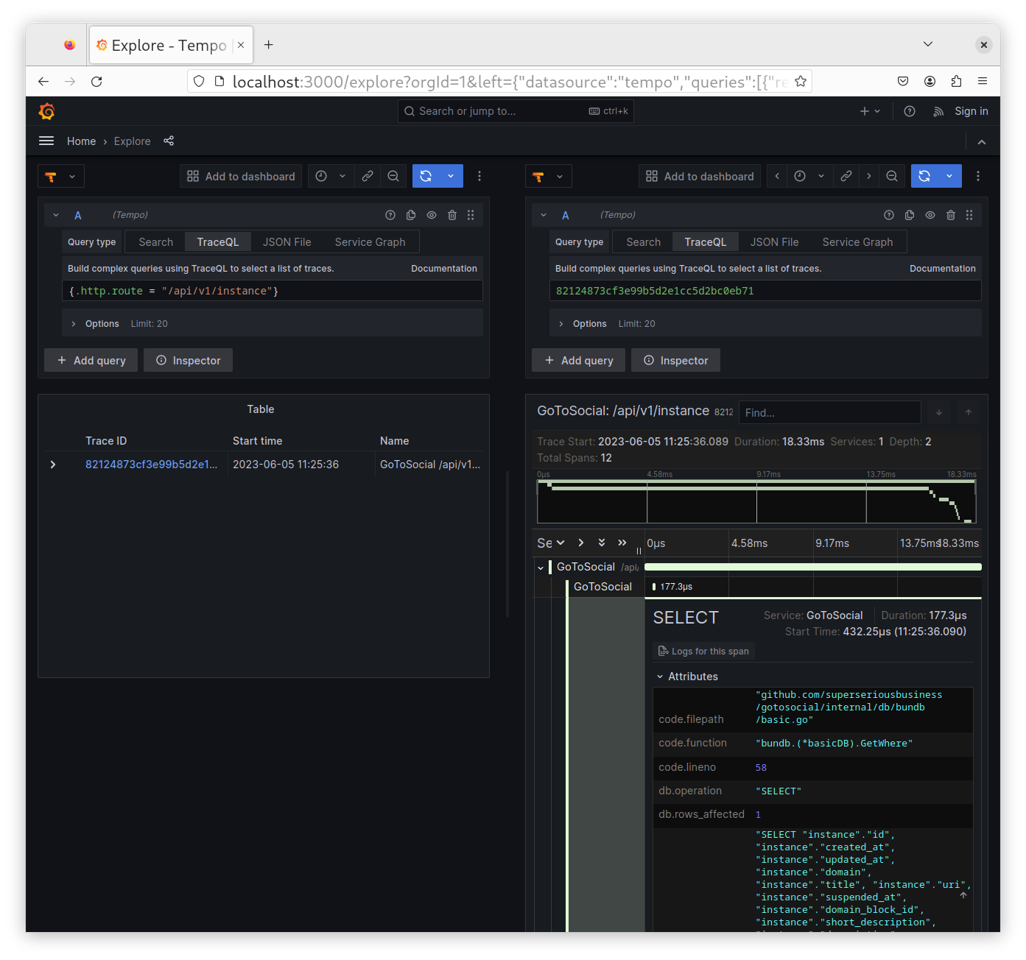
Querying and visualising traces
Once you execute a few queries against your instance, you'll be able to find them in Grafana. You can use the Explore tab and pick Tempo as the datasource. Because our example configuration for Grafana enables TraceQL, the Explore tab will have the TraceQL query type selected by default. You can switch to "Search" instead and find all traces emitted by GoToSocial under the "GoToSocial" service name.
Using TraceQL, a simple query to find all traces related to requests to /api/v1/instance would look like this:
{.http.route = "/api/v1/instance"}
If you wanted to see all GoToSocial traces, you could instead run:
{.service.name = "GoToSocial"}
Once you select a trace, a second panel will open up visualising the span. You can drill down from there, by clicking into every sub-span to see what it was doing.